This was a very interesting project to work on. It was also quite challenging, as it required us to create a device that could tranfer energy while moving itself forwards. We at first attemted to create a stirling engine, and then made a more succesful gravity powered car. A stirling engine is a heat powered engine that consists of two pistons, a hot and a cold. the hot piston is located near the heat source, and gets pushed by air expansion from the heat source. This then powered the wheel by means of a lever system. Also hooked onto the wheel is the cold piston, which pushes down half a revolution after the hot piston's turn. It causes a pressure difference and pushes the hot piston into the start position. This design was not as succesful as we hoped, so we designed a second car that was powered by gravity. We harnessed the power of gravity by wrapping a string around the axle that then wrapped a round a tall tower on the car and then attached to a mass. As the mass descended, the car moved forwards. we used a mass of one kg and a drop height of 0.78 m. The wheels of the car had an MA of 12. The car almost always reached five meters before the mass hit the ground. We learned a lot of different physics consepts during this project.
Spring Constant- A spring constant is a measure of how difficult it is to expand and compress a spring. A spring is anything that you can excert force on to change the shape of. We didnt use a string in our project, but many other groups did. It is found using the formula spring constant=Force/distance, Distance being the distance that you streched it and force being the force needed to do so. It is measured in N/M.
Potential Energy of a Spring- PE of a string is the amount of potential energy a spring has in a certain position. It is found with the equation PE of a spring=1/2*spring constant*distance^2 and it is measured in joules. Once again, we didn't have springs in our project, but many other groups did.
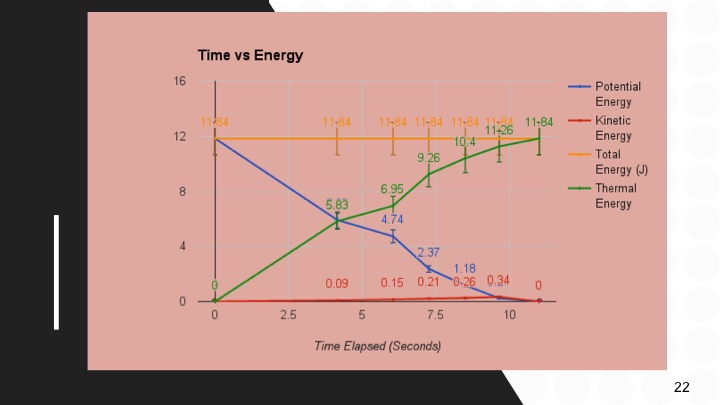
Energy graph- When looking at a situation where energy is being trasferred between potential and kinetic, it is usefull to make an energy graph. An energy graph shows how much potential, kinetic, thermal, and total energy a situation has relative to time. Total energy is the amount of energy in the system, and because of the law of conservation of energy, it always stays the same. Potential energy will start at the same amount as total energy and is inversely proportional to kinetic energy, which will most likely start at zero. As time progresses, the sum of PE and KE will become smaller. This is because some of the energy is dispersed as thermal energy. The thermal energy will continue to rise as time progresses.
Spring Constant- A spring constant is a measure of how difficult it is to expand and compress a spring. A spring is anything that you can excert force on to change the shape of. We didnt use a string in our project, but many other groups did. It is found using the formula spring constant=Force/distance, Distance being the distance that you streched it and force being the force needed to do so. It is measured in N/M.
Potential Energy of a Spring- PE of a string is the amount of potential energy a spring has in a certain position. It is found with the equation PE of a spring=1/2*spring constant*distance^2 and it is measured in joules. Once again, we didn't have springs in our project, but many other groups did.
Energy graph- When looking at a situation where energy is being trasferred between potential and kinetic, it is usefull to make an energy graph. An energy graph shows how much potential, kinetic, thermal, and total energy a situation has relative to time. Total energy is the amount of energy in the system, and because of the law of conservation of energy, it always stays the same. Potential energy will start at the same amount as total energy and is inversely proportional to kinetic energy, which will most likely start at zero. As time progresses, the sum of PE and KE will become smaller. This is because some of the energy is dispersed as thermal energy. The thermal energy will continue to rise as time progresses.
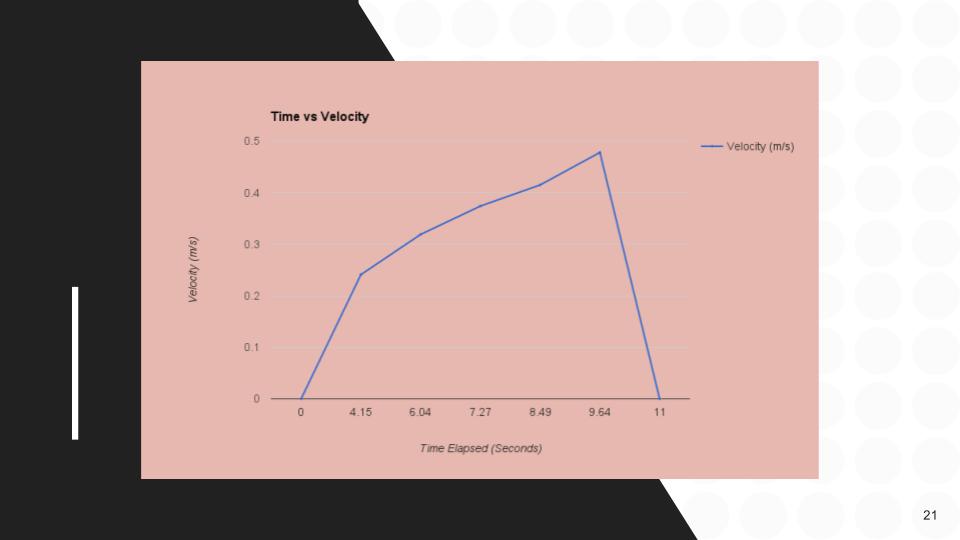
Velocity graphs- To model our car's movement we also used a time vs. velocity graph. This displayed the car's velocity over time. Our car accelerated until the fifth meter, where the mass hit the floor. The maximum speed of the car was just under 5 m/s.
This project was very fun to work on. It was a little different than the previous ones which made it challenging and interesting. We did some parts of this project well and others not so well. We did a good job on the presentation. I think we gave a professional presentation that convinced our audience about our cars. I also think that we did a good job on quickly making a second design when our first one didn't work. Despite this, we also could have improved in some areas. We could have collaborated a little better together. It would have helped us get more stuff done. I also think that we should have been more decisive about what car we were making in the first place. We couldn't decide between the gravity powered car and the Stirling engine. Overall though, I had a lot of fun on this project.
